Debugging
New in 2.0. There are two ways to stop a running app and look inside it: the debugger built into the on-device editor, and a remote debugger your PC drives over TCP or BLE.
Both work on real hardware and in the simulator.
On the device: the editor's debugger
The editor (E on the desktop) can debug an app without any PC involved.
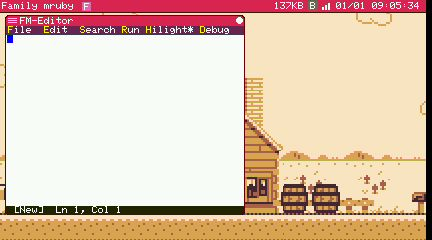
Running
F5 runs the file you are editing. No save-and-launch dance.
Attaching
Debug → Attach... lists the running apps; pick one and the editor splits, showing a stack pane and a variables pane below the text.
Once attached, a gutter appears down the left side of the text where breakpoints live:
| Key | Action |
|---|---|
F5 |
Continue |
F6 |
Pause |
F10 |
Step over |
F11 |
Step in |
Shift + F11 |
Step out |
F7 / F8 |
Move up and down the call stack |
F4 |
Switch between the stack pane and the variables pane |
The Debug menu carries the same commands, plus Toggle BP for setting a breakpoint on the current line and Detach for ending the session.
A breakpoint shows as a red dot in the gutter; the line where execution is parked is highlighted.
One debugger at a time
A device holds one debug session. If the editor is attached, a remote debugger cannot attach as well, and vice versa. Detach before switching.
From your PC: the remote debugger
The device runs a debug service that speaks a msgpack protocol over one of two transports:
| Transport | Where |
|---|---|
| TCP | The Linux simulator, and any target reachable over the network |
| BLE | ESP32 hardware, over a GATT service — no cable needed |
The debug service has no authentication
Neither transport asks who is connecting. The TCP service listens on every interface, and the BLE service uses no pairing or encryption. Anyone who can reach the device can attach to a running app, read its variables, and stop or start apps. Use it on a network you trust. See Security.
The command-line client
tool/debug/fmrb_dbg_client.py in the repository is both a library and a small interactive
client:
# One-shot command
python3 tool/debug/fmrb_dbg_client.py localhost:5555 stack_trace

# Interactive session
python3 tool/debug/fmrb_dbg_client.py localhost:5555

# Over BLE, scanning for a single Family mruby device
python3 tool/debug/fmrb_dbg_client.py ble
The target is host[:port] for TCP (port 5555 by default), or ble, or
ble:<name-or-address> when more than one device is in range.
It needs the msgpack package; BLE additionally needs bleak.
From an editor that speaks DAP
tool/debug/fmrb_dap_adapter.py puts a Debug Adapter Protocol front end on the same client,
so an editor that speaks DAP — VS Code, among others — can set breakpoints, step, and
inspect variables against the running device.
The web console's debug panel
The web console, which talks to the device over BLE from a
browser, has a debug panel for the coarse operations: list the running apps (ps), kill one,
and spawn another. It is the quickest way to get an app off the device when it is
misbehaving, without reaching for a debugger session.
Reading what the system says about itself
Not every problem needs a breakpoint. The system prints its own state periodically, and those numbers usually locate a problem faster:
- Log Viewer in the system menu shows the log on the device
- The periodic dump reports each task's remaining stack, the VM pools' occupancy, and graphics timings
Monitorin the system menu shows running tasks and memory at a glance
For an app that is running out of memory, that dump tells you which pool and how close it is, which a debugger will not.
Related
- Console — moving files and running commands over BLE
- Remote Desktop — driving the device's UI from a browser
- Simulator — debug the whole system on Linux first